Value Stream Mapping (VSM) is the more exciting part of LEAN management. It provides a helicopter view (macro view) of a process. It uncovers areas for improvement (Kaizen Bursts), and each improvement idea can turn into a micro PDCA or PDSA initiative (or rock).
PDCA is the ISO improvement cycle for Plan-Do-Check-Act. PDSA is another variant denoting Plan-Do-Study-Adjust. I find that the DO and ACT in PDCA are a bit confusing or harder to differentiate for newbies.
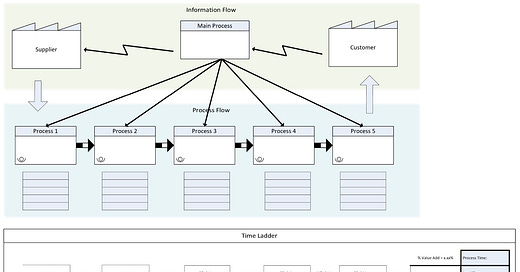
There are 3 sections in a value stream mapping diagram:
(1) Information flow
(2) Process Flow
(3) Time Ladder
Information Flow
VSM begins with a high-level information flow with the customer and sometimes involves the suppliers. The information flow connects with the materials, goods, or services process.
At first glance, VSM resembles the Customer Journey Mapping. Customer journey map is often used in customer relationship management for marketing, sales, and customer service engagement.
CJM focuses on customer interactions.
Improving customer experience and satisfaction.
Value Stream Mapping is more internal focus instead of external customer-oriented, and VSM:
Focuses on information flow, process flow, and time.
Improving the productivity of repetitive cyclical processes, internal focus, and eliminating waste.
However, the VALUE is based on the customer’s perspective. Value is what customers appreciate and are willing to pay for. Waste is the non-value-added activities.
Process Flow
Process flow depicts the high-level block of processes. Unlike the Functional Flow Diagram (FFD) V-Work uses, this VSM process flow is at the macro level, denoting the key measurements of productivity management. We collect data at every major process point, for example:
number of people (workers)
number of shifts
batch size or volume being processed
inventory size or type
defect rate or Completion Accuracy (CA%)
etc. measures that are insightful
We shall identify the wastes within the process flow, such as:
overproduction
overstock in the inventory
over-processing that is unnecessary or value-adding
underutilized resources (workers’ time or skill)
extra motion that could be streamlined
logistics (transport and transfer)
waiting time
Time Ladder
The Time Ladder is a simplistic estimated view of the process timeline. It excludes parallel and overlapping activities, unlike the Gantt Chart. The key objectives are to record the value-adding ratio to the lead time and indicate the waiting time.
waiting time
process time (PT) or value-add time (VAT)
Lead time or cycle time
Evaluate Current State
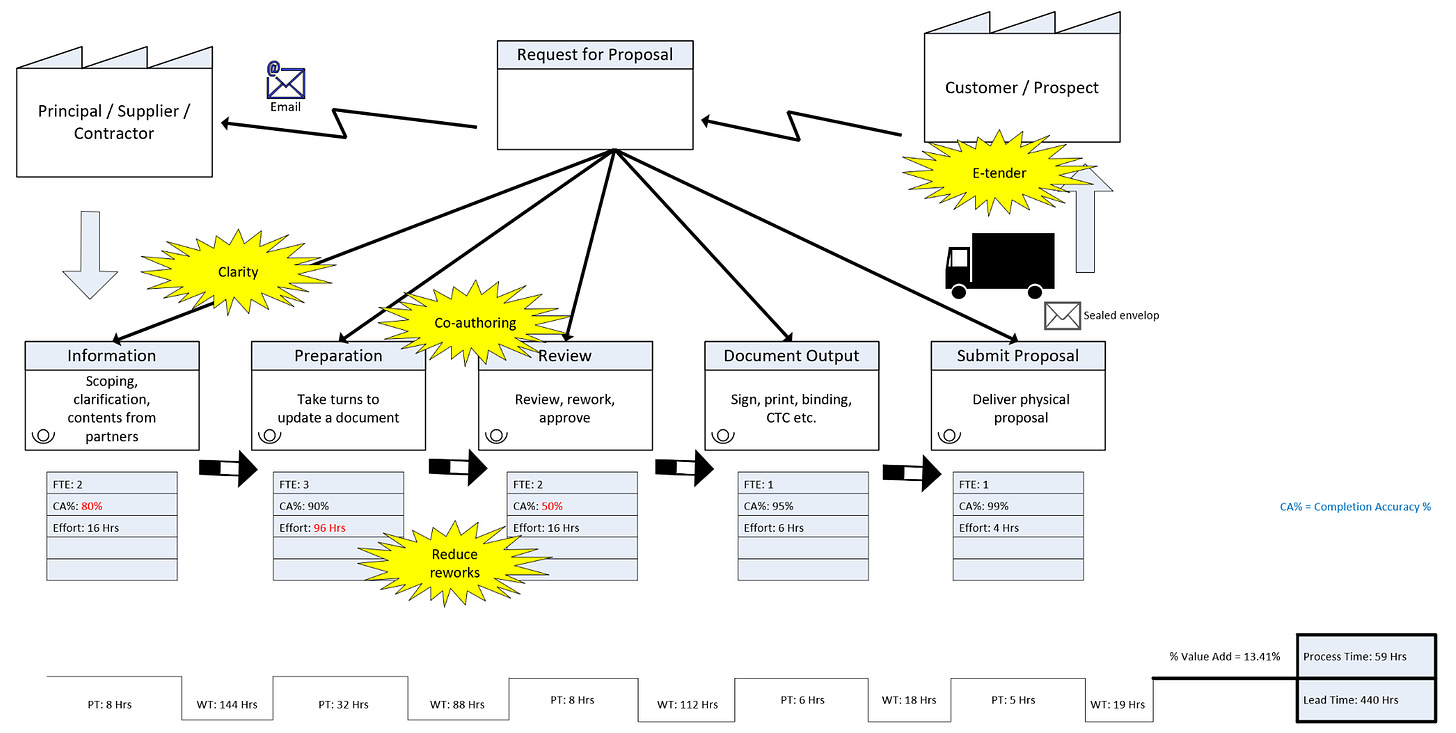
For example, we can explore improvement areas by a sample customer request for proposal (RFP) sample process (not real, just for illustration purposes). Assume the submission is a hard copy of the tender bid proposal.
Evaluate each process if it is:
Valuable to the customer?
Sustainable (having redundancy for high availability)?
Flexible (agile enough to adapt to business changes)?
Capable (perhaps training required)?
Evaluate the information and process flows:
Where are the bottlenecks?
Where are the reworks due to quality issues (poor communication, sub-par output)?
Consistent (low variance)?
I can make the current state more complex by adding the iterations of reworks or getting clarifications with multiple parties.
The investigation uncovers potential improvement areas, denoted as the Kanban Bursts.
Using more polished content templates and training to increase the accuracy (quality) of the proposal preparation to reduce reworks.
Clear communication and training to improve requirement gathering may shorten the information gathering and improve accuracy.
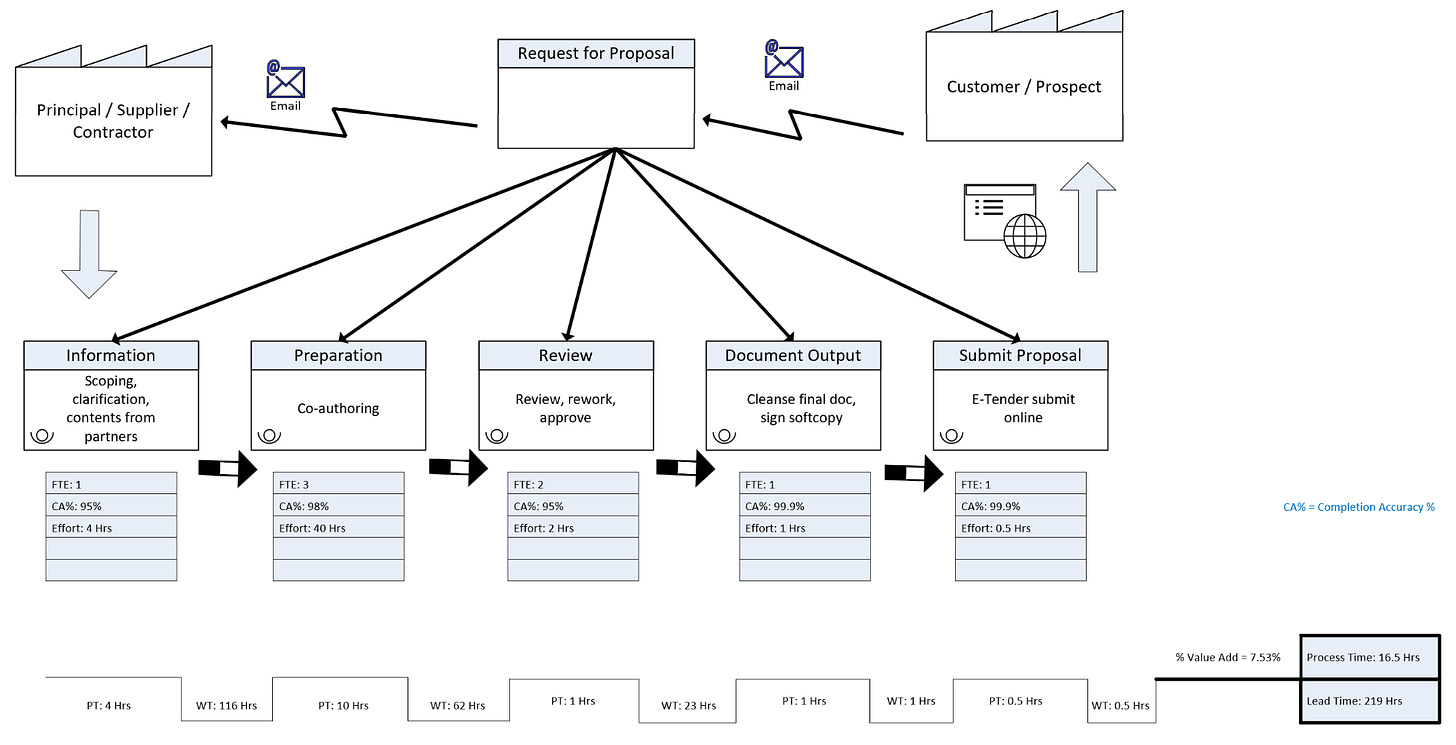
Using a state-of-the-art document management system as a tender library that supports co-authoring, the process can change from the sequential authoring and reviewing process (long waiting time) to real-time co-authoring and editing.
Convince customers to adopt an e-procurement system with an e-tender, which may reduce future requests for quotation or tender submission, submitting softcopy proposals via e-tender instead of printing and submitting the hardcopy printouts by hand.
These are just made-up examples for illustration purposes; they are not realistic measures.
Envision Future State
Each Kanban Burst leads to a PDSA improvement rock over the span of months. The future state helps the team envision the end goal; hence, it can track suitable KPIs (on the Scoreboard as measures) and create rocks and milestones for the operational teams.
Value Streams are often cross-departmental initiatives. In the quarterly reports, Top Management can assign a Value Stream Owner and the sub-process owners.
I am glad to add VSM to V-Work’s Business Operating System (BOS) toolbox under the Lean Management operation.


